> ## Documentation Index
> Fetch the complete documentation index at: https://docs.navattic.com/llms.txt
> Use this file to discover all available pages before exploring further.

# Analyze performance

> Understand the performance of your product demos and visitor behavior.

export const MediaCard = ({title = '', url, type = 'demo'}) => {
  const attributes = type === 'demo' ? {
    'data-navattic-open': url,
    'data-navattic-title': title
  } : {
    'data-video': url
  };
  return <div {...attributes} className="hidden md:inline-block w-auto cursor-pointer overflow-hidden rounded-lg border border-gray-200 dark:border-gray-700 shadow-sm">
<div className="flex items-center gap-3 bg-white dark:bg-gray-800 px-3 py-2">
<div className={`flex h-7 w-7 items-center justify-center rounded-md ${type === 'video' ? 'bg-blue-100 dark:bg-blue-900' : 'bg-orange-100 dark:bg-orange-900'}`} style={{
    backgroundColor: type === 'video' ? 'var(--video-bg)' : 'var(--demo-bg)'
  }}>
<Icon icon={type === 'video' ? 'circle-play' : 'square-mouse-pointer'} color={type === 'video' ? 'var(--video-icon)' : 'var(--demo-icon)'} />
</div>
<div>
<div className="text-sm font-medium text-gray-900 dark:text-gray-100">
{type === 'video' ? 'Watch video' : 'Try a demo'}
</div>
<div className="text-sm text-gray-500 dark:text-gray-400">{title}</div>
</div>
</div>
<style jsx>{`
  :root {
    --video-bg: #dbeafe;
    --video-icon: #2563eb;
    --demo-bg: #ffedd5;
    --demo-icon: #ea580c;
  }
  :global(.dark) {
    --video-bg: #1e3a8a;
    --video-icon: #60a5fa;
    --demo-bg: #7c2d12;
    --demo-icon: #fb923c;
  }
`}</style>
</div>;
};

<Icon icon="chart-no-axes-column-increasing" /> **Analyze** the performance of your product demos to
understand what's working and double down on your visitors are most interested in.

Navattic offers demo and visitor-level engagement insights via the Analytics and Visitors tabs. Additionally, within each Product Demo, users can access Flow completion rates under the Activity tab. To send Navattic data to another platform or your marketing website, visit [Integrations](/integrations).

## Product Demo Analyze tab

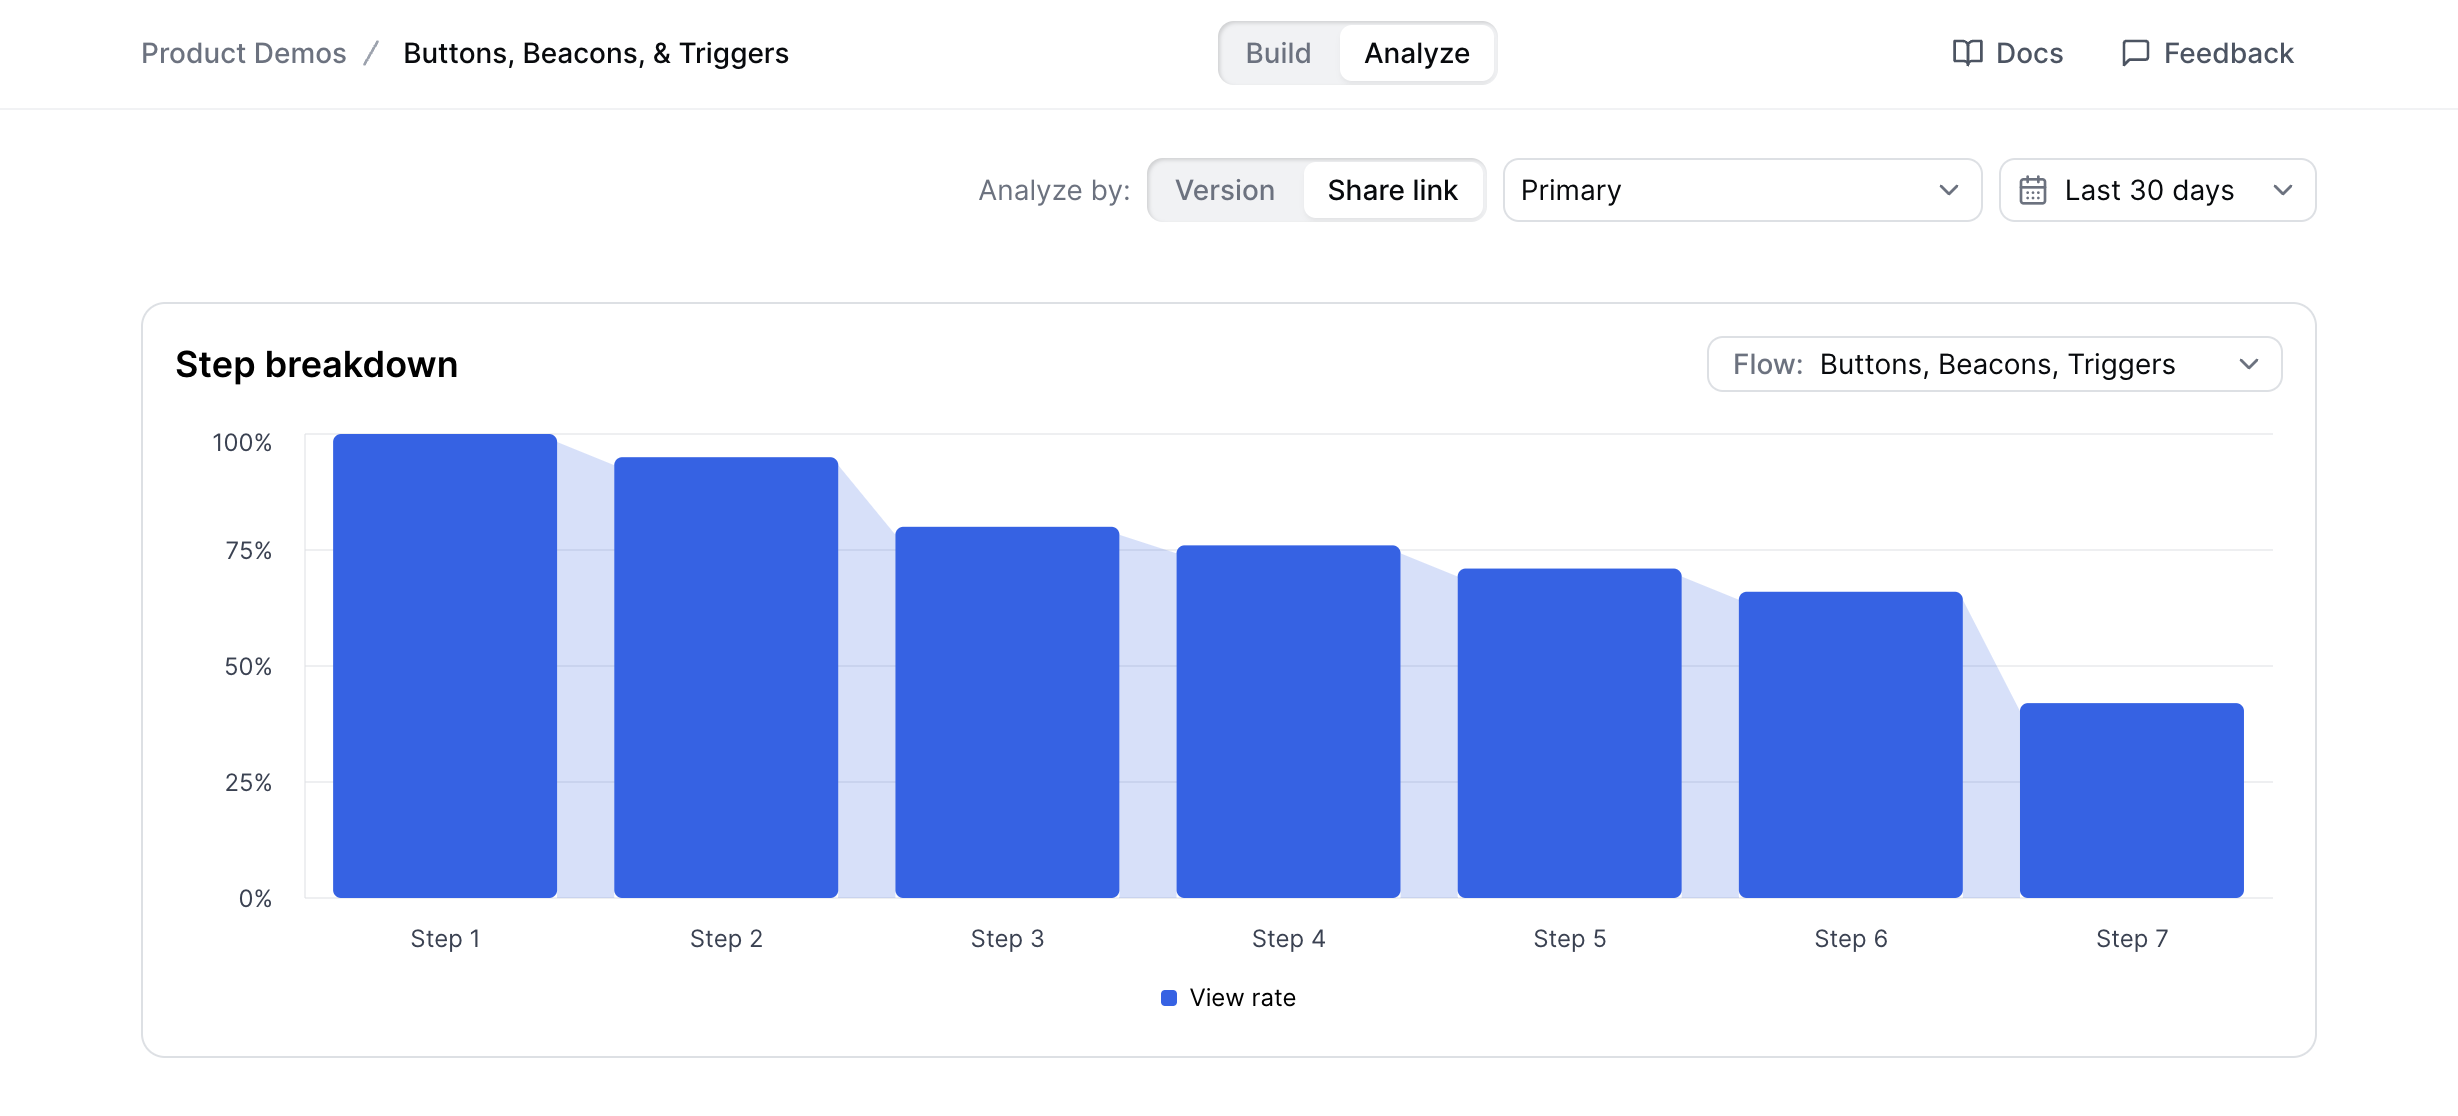
The <Icon icon="chart-no-axes-column-increasing" /> **Analyze tab** for each demo contains this specific demo's Visitors and Step completion rates. Click into a Visitor to view details about their form submissions and the actions they have taken throughout your demo and examine which steps visitors are dropping off at under **Step breakdown**.

<Frame>
  <img src="https://mintcdn.com/navattic-app/V8lxP8WymXcsG6Oa/images/analyze-performance-1.png?fit=max&auto=format&n=V8lxP8WymXcsG6Oa&q=85&s=9a1d3f9b9e87aa248a014a88aa90b8fe" alt="Analyze tab" width="2458" height="1116" data-path="images/analyze-performance-1.png" />
</Frame>

If your demo contains video steps, you can see playback analytics below the step breakdown chart. The chart shows the number of views for every 5-second interval of the video. Visitors who re-watch portions of the video will be counted multiple times.

<Frame>
  <img src="https://mintcdn.com/navattic-app/o5zxrKft2mXN97vW/images/analyze-video-drop-off.png?fit=max&auto=format&n=o5zxrKft2mXN97vW&q=85&s=dd121b6e3e38cba561f27d1441ee47fe" alt="Video playback analytics" width="1804" height="780" data-path="images/analyze-video-drop-off.png" />
</Frame>

<br />

<MediaCard title="Analyze tab" url="https://navattic-docs.navattic.com/yl3w0w3k" />

**If you identify a step with greater drop-off than others:**

* Investigate the appearance of the step: Could customers be confused by the text or other elements at this step?
* Consider adding a CTA before this step to engage viewers before they exit the demo
* Let us know - our team is happy to provide tailored guidance for your demo!

## Analytics Dashboard

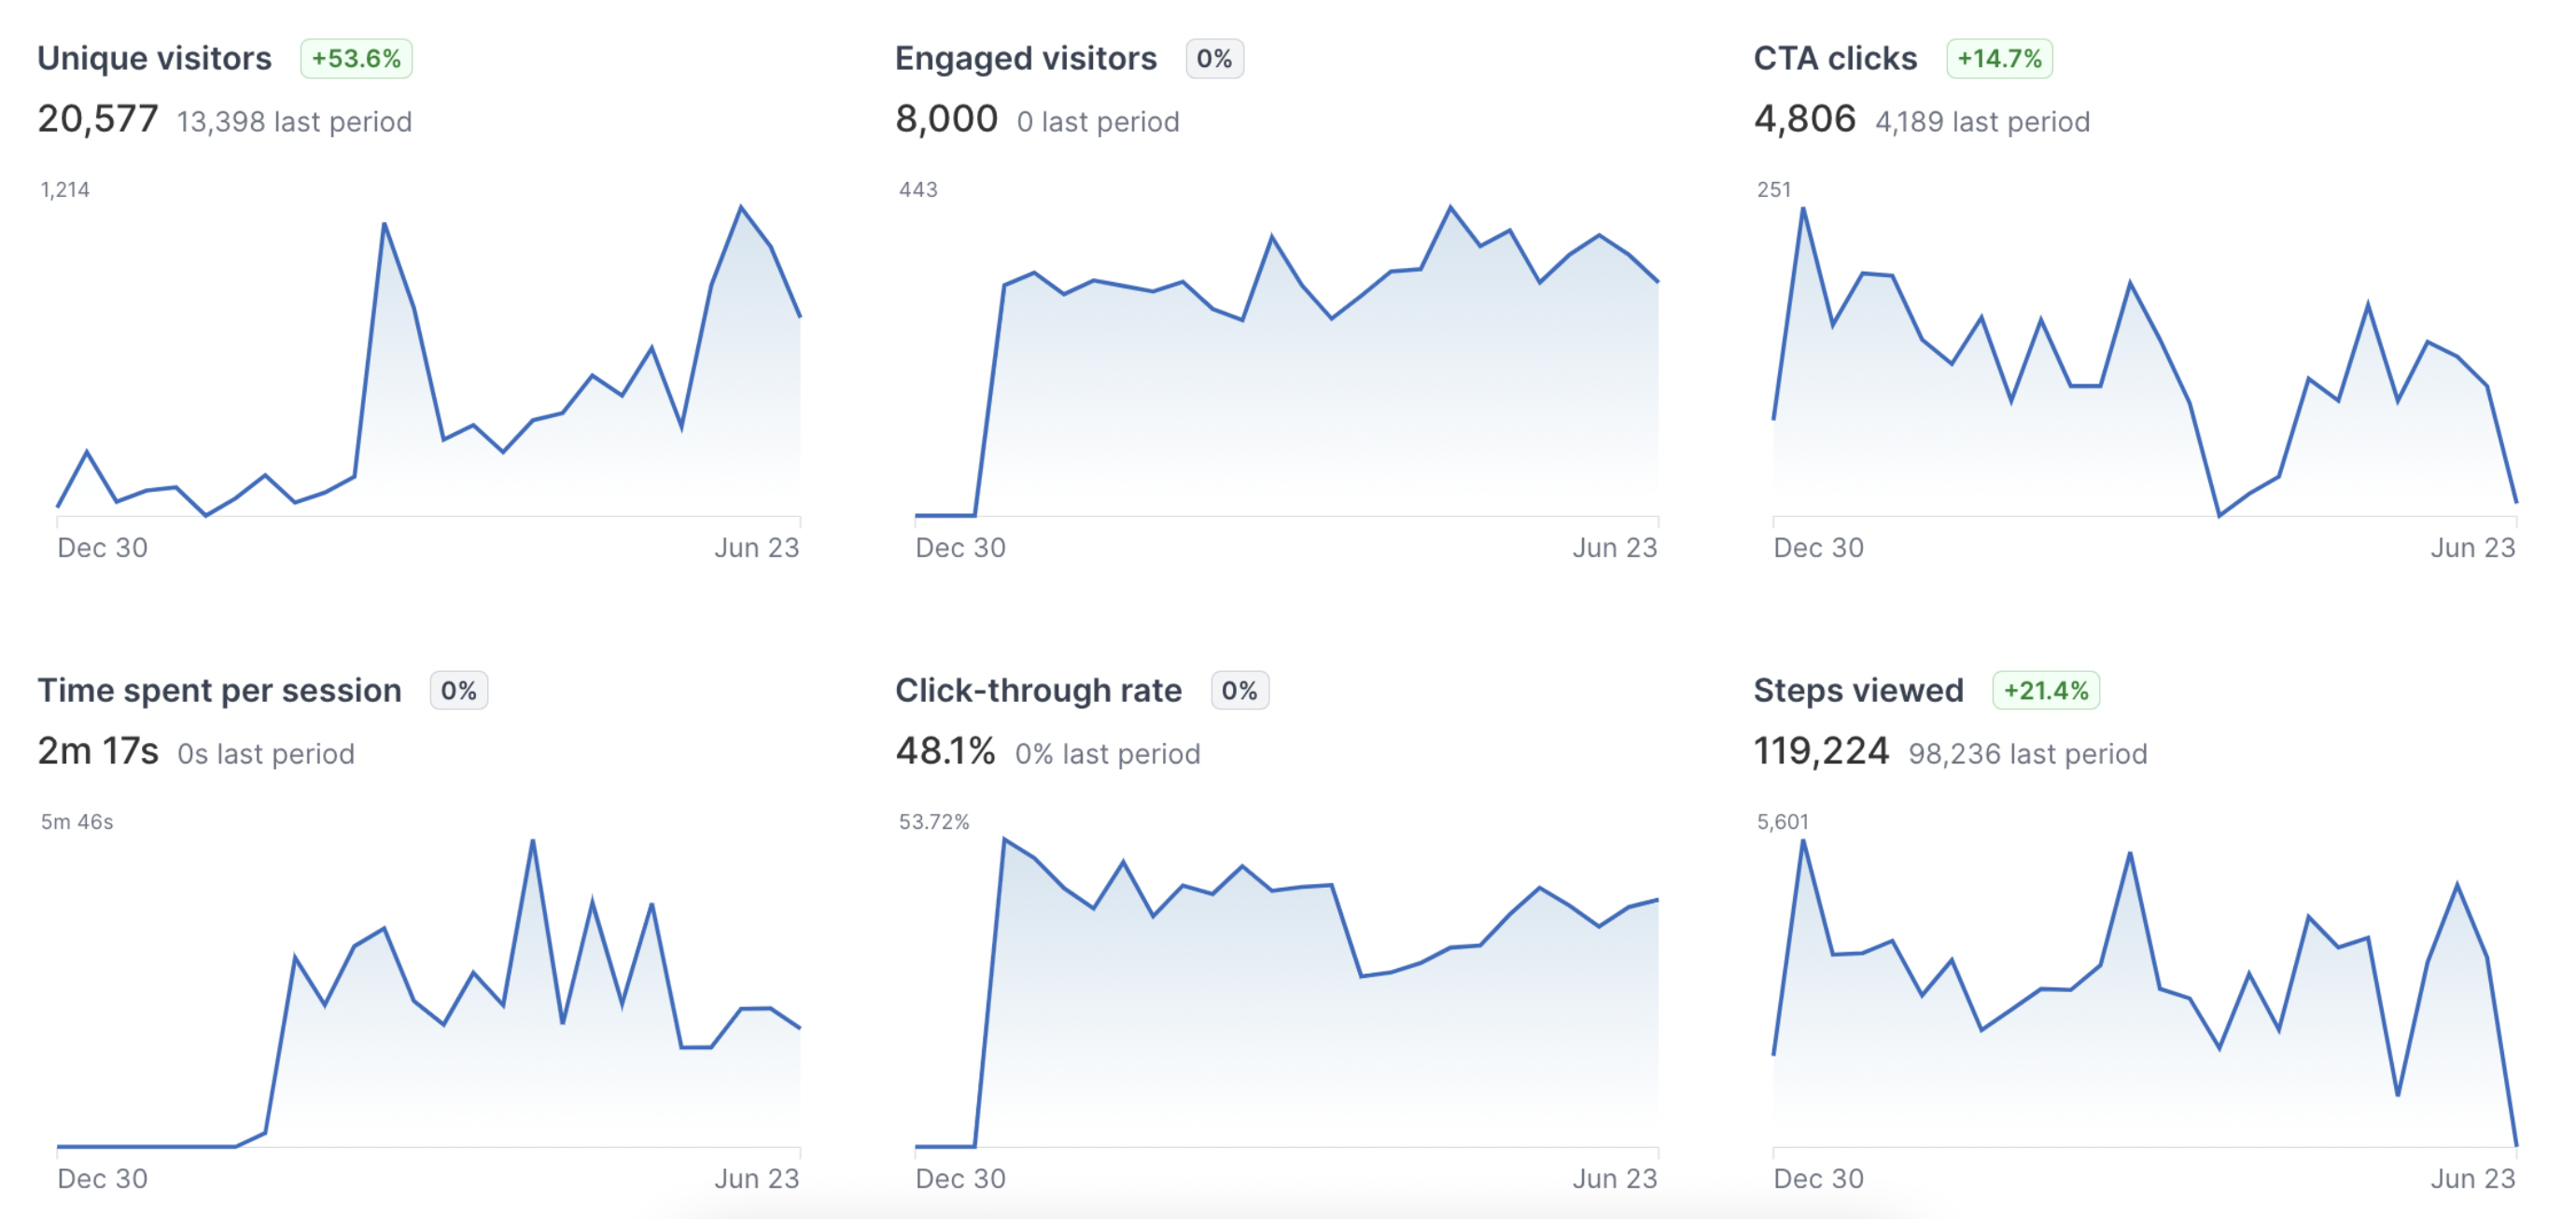
The <Icon icon="chart-no-axes-column-increasing" /> **Analytics Dashboard** is a way to understand the performance of all your demos across the workspace.

<Frame>
  <img src="https://mintcdn.com/navattic-app/V8lxP8WymXcsG6Oa/images/analyze-performance-2.png?fit=max&auto=format&n=V8lxP8WymXcsG6Oa&q=85&s=9bedb8482e609a482d5254ba23a89cfe" alt="Analytics Dashboard" width="2760" height="1306" data-path="images/analyze-performance-2.png" />
</Frame>

<br />

<MediaCard url="https://www.loom.com/share/16f7e9aa026c48fba8e13ae7d01af7bc?sid=a0ca68ae-a4d2-486c-9365-97952b9fa57e" title="Analyze dashboard" type="video" />

#### Metric definitions

Use this to identify changes over time that may correspond with marketing initiatives. For example, did your click-through rate increase singificantly due to a seasonal campaign?

Use Filters to see the following metrics for a particular Product Demo or Timeframe.

| Metric                     | Description                                                                                                                                        |
| -------------------------- | -------------------------------------------------------------------------------------------------------------------------------------------------- |
| **Unique visitors**        | The total number of visitors to step 1 of your demo                                                                                                |
| **Engaged visitors**       | Unique visitors who advance 1+ steps in your demo                                                                                                  |
| **CTA clicks**             | The total number of visitor engagments with a CTA in your demo (we recommend adding CTAs at [these conversion points](/build/flows#click-actions)) |
| **Time spent per session** | How long the average user spends on a browser tab containing your demo                                                                             |
| **Click-through rate**     | The total number of times a Visitor clicked a CTA on the demos divided by the total number of engage events.                                       |
| **Steps viewed**           | The total number of demo steps viewed across your workspace                                                                                        |

## Pipeline Impact

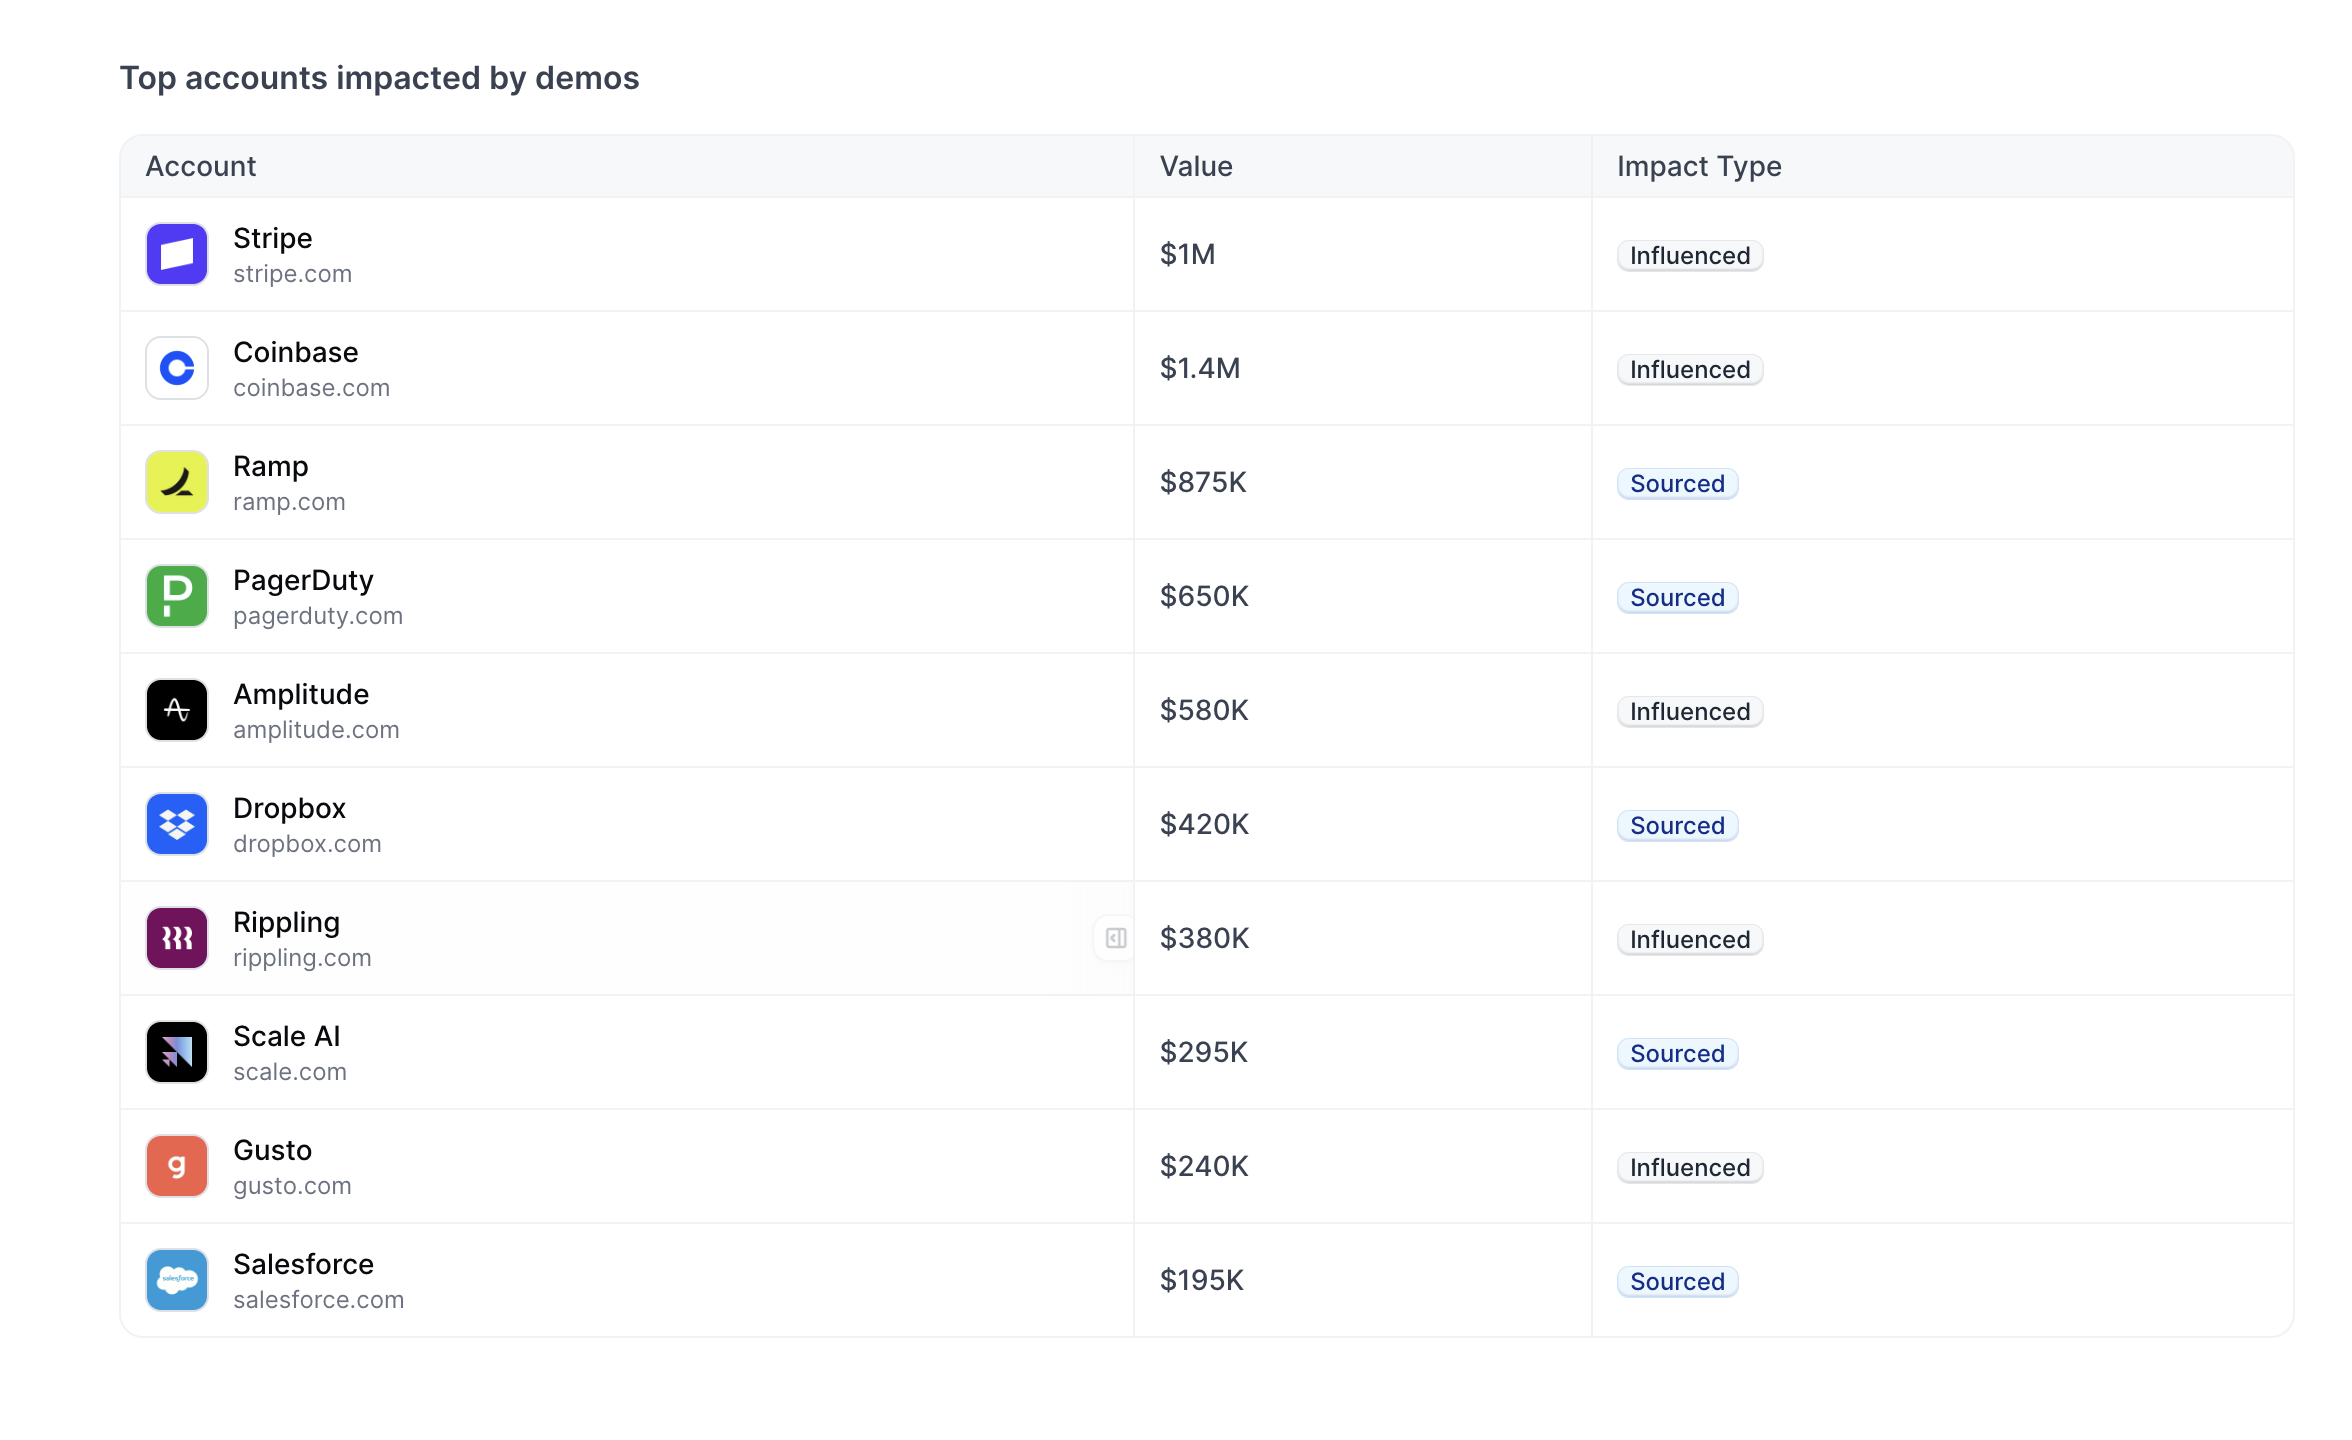
The <Icon icon="chart-no-axes-column-increasing" /> **Pipeline Impact** dashboard provides visibility into how your demos influence pipeline and revenue, connecting demo engagement to business outcomes through CRM integration.

<Frame>
  <img src="https://mintcdn.com/navattic-app/jgjY98pL_ucFz0fP/images/pipeline-impact-dashboard.png?fit=max&auto=format&n=jgjY98pL_ucFz0fP&q=85&s=502122232c34f3139b3023b425bb4485" alt="Pipeline Impact Dashboard" width="2352" height="1504" data-path="images/pipeline-impact-dashboard.png" />
</Frame>

<Frame>
  <img src="https://mintcdn.com/navattic-app/jgjY98pL_ucFz0fP/images/pipeline-impact-top-accounts.png?fit=max&auto=format&n=jgjY98pL_ucFz0fP&q=85&s=4ddbead1ddeb618be9619541f6283ede" alt="Top Accounts Impacted by Demos" width="2352" height="1440" data-path="images/pipeline-impact-top-accounts.png" />
</Frame>

#### Metric definitions

Use the Pipeline Impact dashboard to understand how demo engagement translates to pipeline creation and revenue impact. Filter by date range to see metrics for a specific time period.

| Metric                               | Description                                                                                                                                                             |
| ------------------------------------ | ----------------------------------------------------------------------------------------------------------------------------------------------------------------------- |
| **Total Accounts**                   | Counts unique accounts that have viewed any demos within the selected date range.                                                                                       |
| **Total Engaged Accounts**           | Counts accounts that have advanced past the first step of a demo or engaged with a checklist.                                                                           |
| **Total Converted Accounts**         | Counts accounts that have interacted with a CTA within the demo.                                                                                                        |
| **Sourced Pipeline**\*               | Shows opportunities where the account's first demo view occurred before the opportunity was created.                                                                    |
| **New Accounts Sourced**\*           | Counts CRM accounts that were created after the contact's first demo view.                                                                                              |
| **Engaged Leads**\*                  | Counts individual contacts who have viewed demos. Breaks down into "sourced" (demo before contact creation) vs "influenced" (demo after).                               |
| **Influenced Pipeline**\*            | Shows opportunities where a demo view occurred at any point during the deal cycle.                                                                                      |
| **Total Revenue Impacted**\*         | Time-series line chart showing pipeline value over the selected date range. Plots Total Revenue, New Pipeline (sourced), and Influenced Pipeline.                       |
| **Value with Demos**\*               | Shows the dollar value of influenced pipeline as a percentage of total impacted pipeline.                                                                               |
| **Top Accounts Impacted by Demos**\* | Table showing the top 10 accounts sorted by deal value where demos had impact. Displays account name, deal value, deal stage, and whether it was "new" or "influenced". |

<Note>
  \* These metrics require a connected CRM. If Pipeline Impact or Sales Impact shows a **Connect your CRM** prompt, use the dropdown to select <img src="https://mintcdn.com/navattic-app/rptQv_Iq6w06CEaq/images/salesforce.svg?fit=max&auto=format&n=rptQv_Iq6w06CEaq&q=85&s=a52c32327bc98ac8fd07bce1941cccb1" alt="Salesforce Logo" className="h-4 w-4 inline-block m-0 -mt-px" width="2500" height="1750" data-path="images/salesforce.svg" /> [Salesforce](/integrations/salesforce) or <img src="https://mintcdn.com/navattic-app/CaLa6x42vs1NHRL9/images/hubspot.svg?fit=max&auto=format&n=CaLa6x42vs1NHRL9&q=85&s=1431f8e82fd1d18212e66b684c438df0" alt="HubSpot Logo" className="h-4 w-4 inline-block m-0 -mt-px" width="2500" height="2500" data-path="images/hubspot.svg" /> [HubSpot](/integrations/hubspot) and follow the setup steps in your workspace settings.

</Note>

## Compare Product Demo Analytics

To compare the Analytics of two Product Demos, visit **Analytics** > **Compare** > **Product demos** > Select demo 1 and Select demo 2. You can also adjust the time period you would like to view using the calendar drop down. One of your demos will have a blue dot and one will have a gray dot next to the title which is the graph key.

### View Highest Performing Demos

To identify your highest-performing demos in Analytics, visit the Analytics tab and select **Compare** > **Highest Performing Demos** from the dropdown menu to view your top five demos for each section.

### A/B Testing

<Info>
  A/B Testing is available on the **Base** plan and above.
</Info>

<Icon icon="split" /> **A/B testing** allows you to compare two different demo variations to determine which one performs better with your audience. By splitting traffic between two demos, you can make data-driven decisions about which demo experiences resonate most with visitors.

#### Creating an A/B Test

To create an A/B test:

1. Navigate to **Settings** in your workspace
2. Select **A/B Tests** from the settings menu
3. Click **Create test**
4. Select your two demo variations:
   * **Demo A**: Choose your first demo variation
   * **Demo B**: Choose your second demo variation
5. Configure your traffic split using the slider
   * Adjust the percentage of visitors who will see each demo
   * The split must total 100% (e.g., 50% Demo A, 50% Demo B)
6. Click **Create** to generate your A/B test

<Note>
  You must select two different demos for your A/B test. Each demo should represent a distinct variation you want to test.
</Note>

#### Sharing Your A/B Test

Once you create an A/B test, Navattic generates a unique link that automatically routes visitors to the appropriate demo variation:

1. From the A/B Tests list, click the **link icon** or select **Copy Link** from the menu
2. Copy the provided URL
3. Share this link on your website, in emails, or anywhere you want to run the test

<Tip>
  The link format is: `https://[your-domain]/split/[test-id]`. This single link handles all traffic routing automatically.
</Tip>

#### Analyzing A/B Test Results

View your A/B test performance by clicking **Analyze** on any test:

1. Navigate to **Analytics** in your workspace
2. Select your A/B test from the comparison options
3. Review key metrics for both demo variations:
   * View counts
   * Engagement rates
   * Completion rates
   * Time spent in demo
   * Form submissions
   * Any custom metrics you track

The analytics view displays metrics side-by-side, making it easy to identify which demo variation performs better.

## Visitor Data and CSV Exports

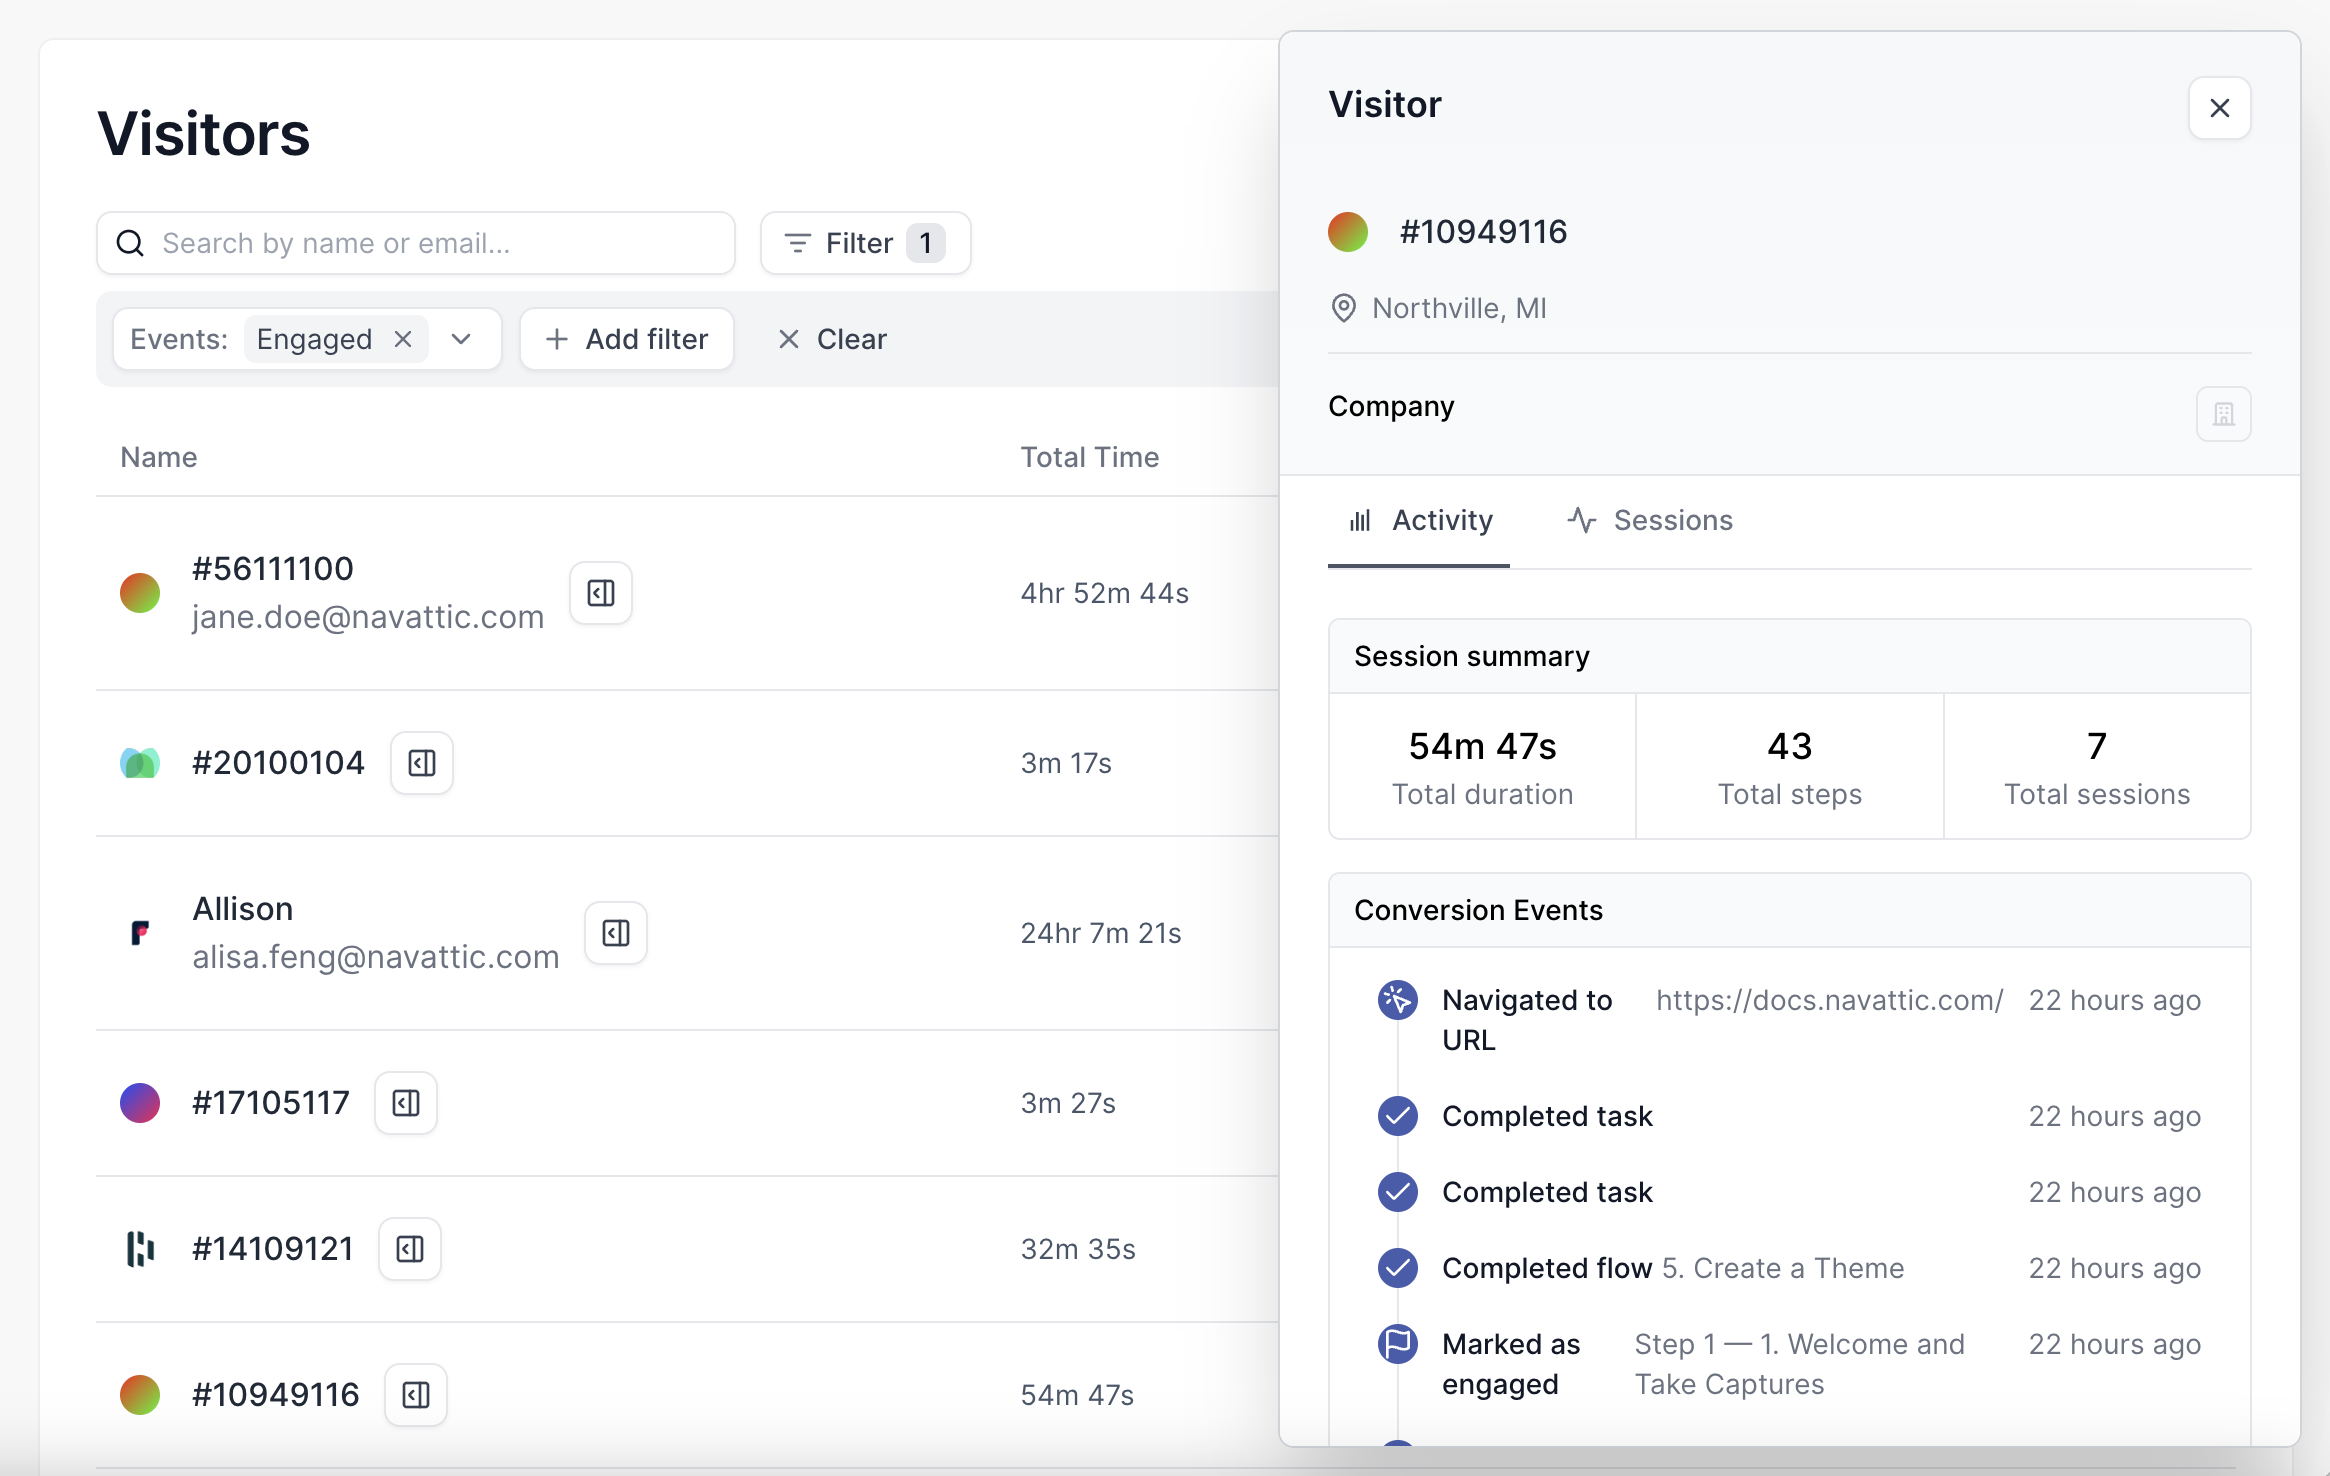
The **Visitors page** within Navattic contains a full list of all users who have engaged with your demos. Identified visitors will include their name and email (if provided via a Navattic form or query strings); anonymous visitors will be assigned an unique ID that is tied to their browser profile.

<MediaCard title="Visitor Analytics" url="https://navattic-docs.navattic.com/8s208oo" />

<img src="https://mintcdn.com/navattic-app/V8lxP8WymXcsG6Oa/images/analyze-performance-3.png?fit=max&auto=format&n=V8lxP8WymXcsG6Oa&q=85&s=83327b242e148c5d42dad4dafffa2c64" alt="" width="2330" height="1476" data-path="images/analyze-performance-3.png" />

**Engagement Details** for each visitor includes all the demos they have engaged with. Visitors who viewed multiple demos or conducted multiple sessions will have all their information consolidated here.

**Conversion Events** indicate that a visitor "Navigated to URL", or clicked a CTA that redirected them outside of your demo.

**From the Visitors tab, you can also:**

* **Filter** Visitors by Engagement, Demos, Flows, or Emails (if using Forms).
* **Export** a .CSV file of your 5,000 most-recent visitors. For Visitors who have completed multiple Flows, Navattic will export the most-recently completed Flow or Demo to avoid creating duplicate records.

<Note>
  Tip: Explore our [Integrations](/integrations) to send Visitor data to other tools like Slack,
  Salesforce, Hubspot, Marketo, and more.
</Note>

<Info>
  Read the Blog: [5 Ways to Get More out of Your Interactive Demo
  Data](https://www.navattic.com/blog/interactive-demo-data)
</Info>

### FAQs

<AccordionGroup>
  <Accordion title="How do I track converted Visitors in Navattic?">
    First, add a' ' ["Mark as Converted"](/build#A_TJC)' ' click action to the primary CTA button in
    your demo. Next, visit your Navattic Workspace > **Visitors** > **Filters** > Events:
    **Converted**. If you only want to see converted Visitors for a specific demo, you can also add
    a Product Demo Filter.
  </Accordion>

  <Accordion title="How do I see the total number of Visitors for a Demo?">
    From your Visitors tab, Filter by your Product Demo name to see only the Visitors who have
    engaged with this Demo.
  </Accordion>

  <Accordion title="How do I separate Product Demo Analytics for different embeds or links?">
    There are several ways to separate engagement data if you are using the same demo in multiple
    places. **Our recommendation** is to create [different share links](/product-updates#k7xAg) for
    your product demo and to view the /path in your CSV export.
  </Accordion>

  <Accordion title="Do demos with or without Forms see more user engagement?">
    Form-gated demos may see a higher % of conversion events, as viewers who complete a Form are
    oftentimes higher-intent. However, we have found ungated demos had about on average 12% higher
    completion and 5% higher engagement rates.
  </Accordion>

  <Accordion title="Why are there a lot of Step 1 views?">
    If your demo is embedded as an iFrame on a high-traffic landing page **and** does not include a
    third-party form, each website visitor is "loading" the first step of your demo. In this case,
    Step 1 views represent each time your webpage has been loaded and may include users who do not
    click into your demo; for ungated embedded demos, Step 2 views would provide a better
    representation for how many users have interacted with each Demo.
  </Accordion>

  <Accordion title="Why are there more Views for later steps?">
    Within the Product Demo page, each step view represents a time that page has been loaded. If a
    user refreshes a particular step of your demo, this will count this as two views. If present,
    this discrepancy is usually small.
  </Accordion>

  <Accordion title="How do I add UTMs to an embedded demo?">
    To track UTMs for Visitors to an embedded demo, add your UTMs to the **end of the src link** in
    your Navattic Website Embed code (the highlighted section below). Note that Navattic does not
    pull UTMs from the top frame of the page for embedded demos.
  </Accordion>

  <Accordion title="How can I configure my Navattic form to accept only business/work emails?">
    To ensure visitors enter their work email in a Navattic form, navigate to the Form > Select
    **Email** > form field to open the settings > toggle on **Require work email**.
  </Accordion>
</AccordionGroup>